
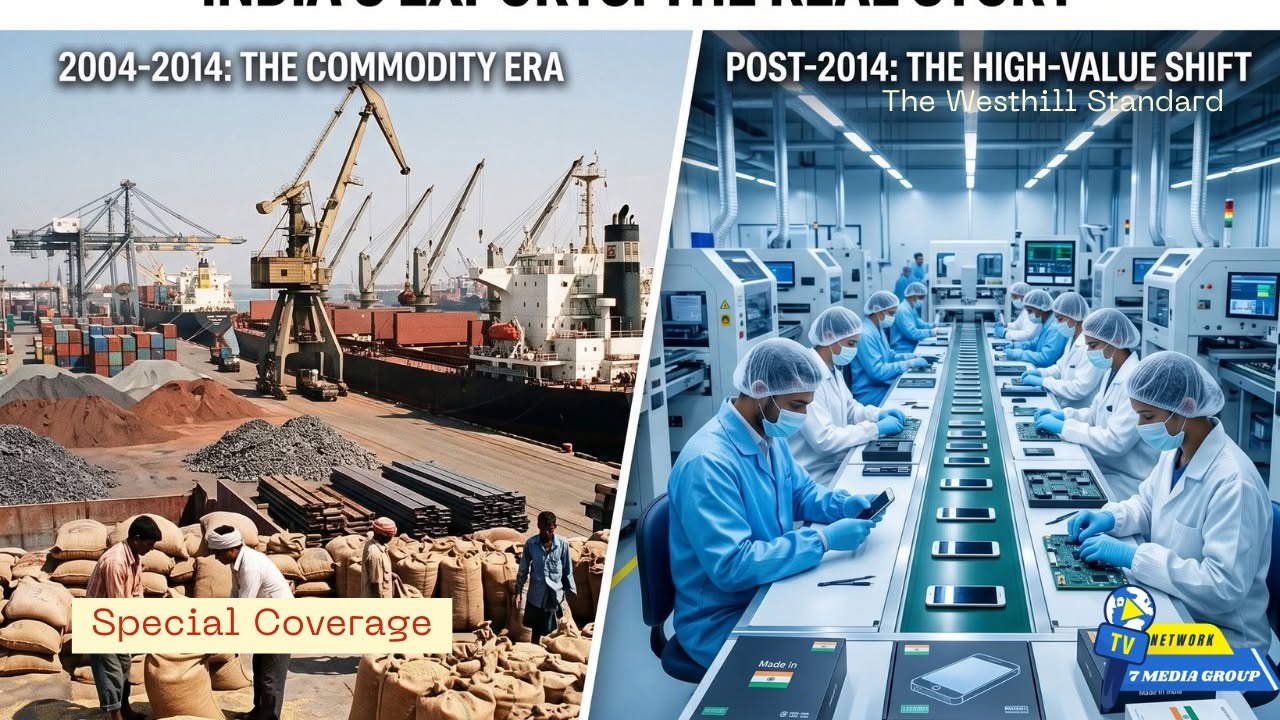
The narrative surrounding India’s export performance shifts significantly depending on whether the metric is percentage growth or absolute volume. An independent analysis reveals that while the United Progressive Alliance (UPA) era experienced higher percentage growth driven by global trade booms, the National Democratic Alliance (NDA) era has seen record absolute volumes and a structural shift toward domestic manufacturing despite global headwinds.
An independent analysis of India’s export story reveals two distinct eras of growth driven by entirely different engines. The real story isn’t just a political scorecard of who achieved a higher percentage—it is a tale of shifting global economic tides and a fundamental transformation in what India actually sells to the world.
During the UPA years (2004–2014), India’s export growth was blistering, primarily lifted by a massive boom in global trade and commodity prices. Under the NDA (2014–present), percentage growth slowed due to global economic stagnation, trade wars, and the pandemic, but the absolute value of exports hit historic highs, driven by a structural shift toward high-value manufacturing and services.

The Structural Transformation
The true contrast between the two eras lies in the changing DNA of India’s export basket:
- The Electronics Boom: In 2014, India exported a negligible $200 million in mobile phones. By 2023-24, driven by major players like Apple shifting assembly to India, mobile phone exports skyrocketed to $15.6 billion. Electronic goods are now among India’s top five exports.
- Engineering and Pharmaceuticals: Moving away from raw materials, India has established itself as a hub for complex manufacturing. Engineering goods surged to over $109 billion, and pharmaceutical exports nearly doubled from $15 billion (2013-14) to $27.8 billion (2023-24).
- The Services Juggernaut: While the IT boom began well before 2014, it evolved under the NDA from basic call centers to Global Capability Centers (GCCs), R&D, and high-end financial services, pushing services exports past the $340 billion mark.
The Verdict: The UPA era wins on pure percentage growth, heavily aided by a booming global economy. The NDA era wins on absolute scale, resilience against global stagnation, and successfully upgrading India’s export machinery from traditional goods to high-tech manufacturing and premium services.The UPA Era: Riding the Global Wave
The UPA government oversaw a golden period for emerging markets. From 2004 to 2014, global demand was voracious, and commodity prices were high. India’s exports mirrored this global boom, growing by over 126% during UPA-2 alone. However, the export basket was still heavily reliant on traditional sectors like textiles, gems and jewellery, and raw materials, making it highly sensitive to global commodity cycles.
The NDA Era: Navigating Headwinds and Structural Shifts
When the NDA took power in 2014, the global commodity super-cycle had crashed, and world trade growth was flatlining. Consequently, India’s export growth in the early NDA years was sluggish—hovering around 10% in the first five years. However, post-COVID, the NDA administration leveraged geopolitical shifts (“China Plus One”) and implemented Production Linked Incentive (PLI) schemes.
The UPA Era (2004–2014): The Global Trade Wave
- Exports grew at a rapid compound rate of 18.75% during an eight-year span of the UPA government.
- During UPA-2 specifically, exports experienced a blistering 126% growth.
- This expansion was heavily supported by a global economic boom, with world trade growing by 50% between 2009 and 2014.
- However, this period also saw a rapidly widening trade gap, with the trade deficit increasing at a compound rate of 17.08%.
The NDA Era (2014–2024): Absolute Scale and Consolidation
- Initial export growth under the NDA was slower, registering just above 10% in its first five years.
- This early sluggishness mirrored global economic stagnation, as world trade grew a mere 3.7% between 2014 and 2018.
- Despite these headwinds, India’s goods and services exports eventually climbed to record territory, totaling approximately $776 billion by 2022–2023.
- The NDA administration successfully managed the trade gap, restricting trade deficit growth to 6.80% over an eight-year period.
Changing the Export DNA
- Services exports more than doubled, reaching $709.84 billion during the 2014–2024 decade, compared to $305 billion under the UPA.
- The defence sector saw a massive transformation, with exports growing over 20 times compared to the UPA era’s total of Rs 4,312 crores.
- Driven by Production Linked Incentive (PLI) schemes and Make in India, specific sectors surged; the biotechnology sector, for example, expanded 13-fold from $10 billion in 2014 to over $130 billion in 2024.
The real story is a transition from high-velocity growth reliant on favorable global currents to a more structurally diverse export portfolio that achieves higher absolute values in a volatile global market.

